Day-0 Discrepancy Audit
Report: max_report.tex, §1 Data Cleaning, Figure 1. Source: forecasting-bias-ibes/max/ scripts and their saved outputs. Audited 2026-09-26.
7_forecast_anchor_distance_histogram.py picked it automatically because it was the largest parquet on disk. The "746,626 forecasts within 100 days" in the text is really a file already cut to Days {0, 1}. Rebuilt from the raw price-target file, Day 0 is about 12.8% of forecasts in the 0–100 day window. It is still the busiest single day, but it is not a third or half of the sample.1What the report claims
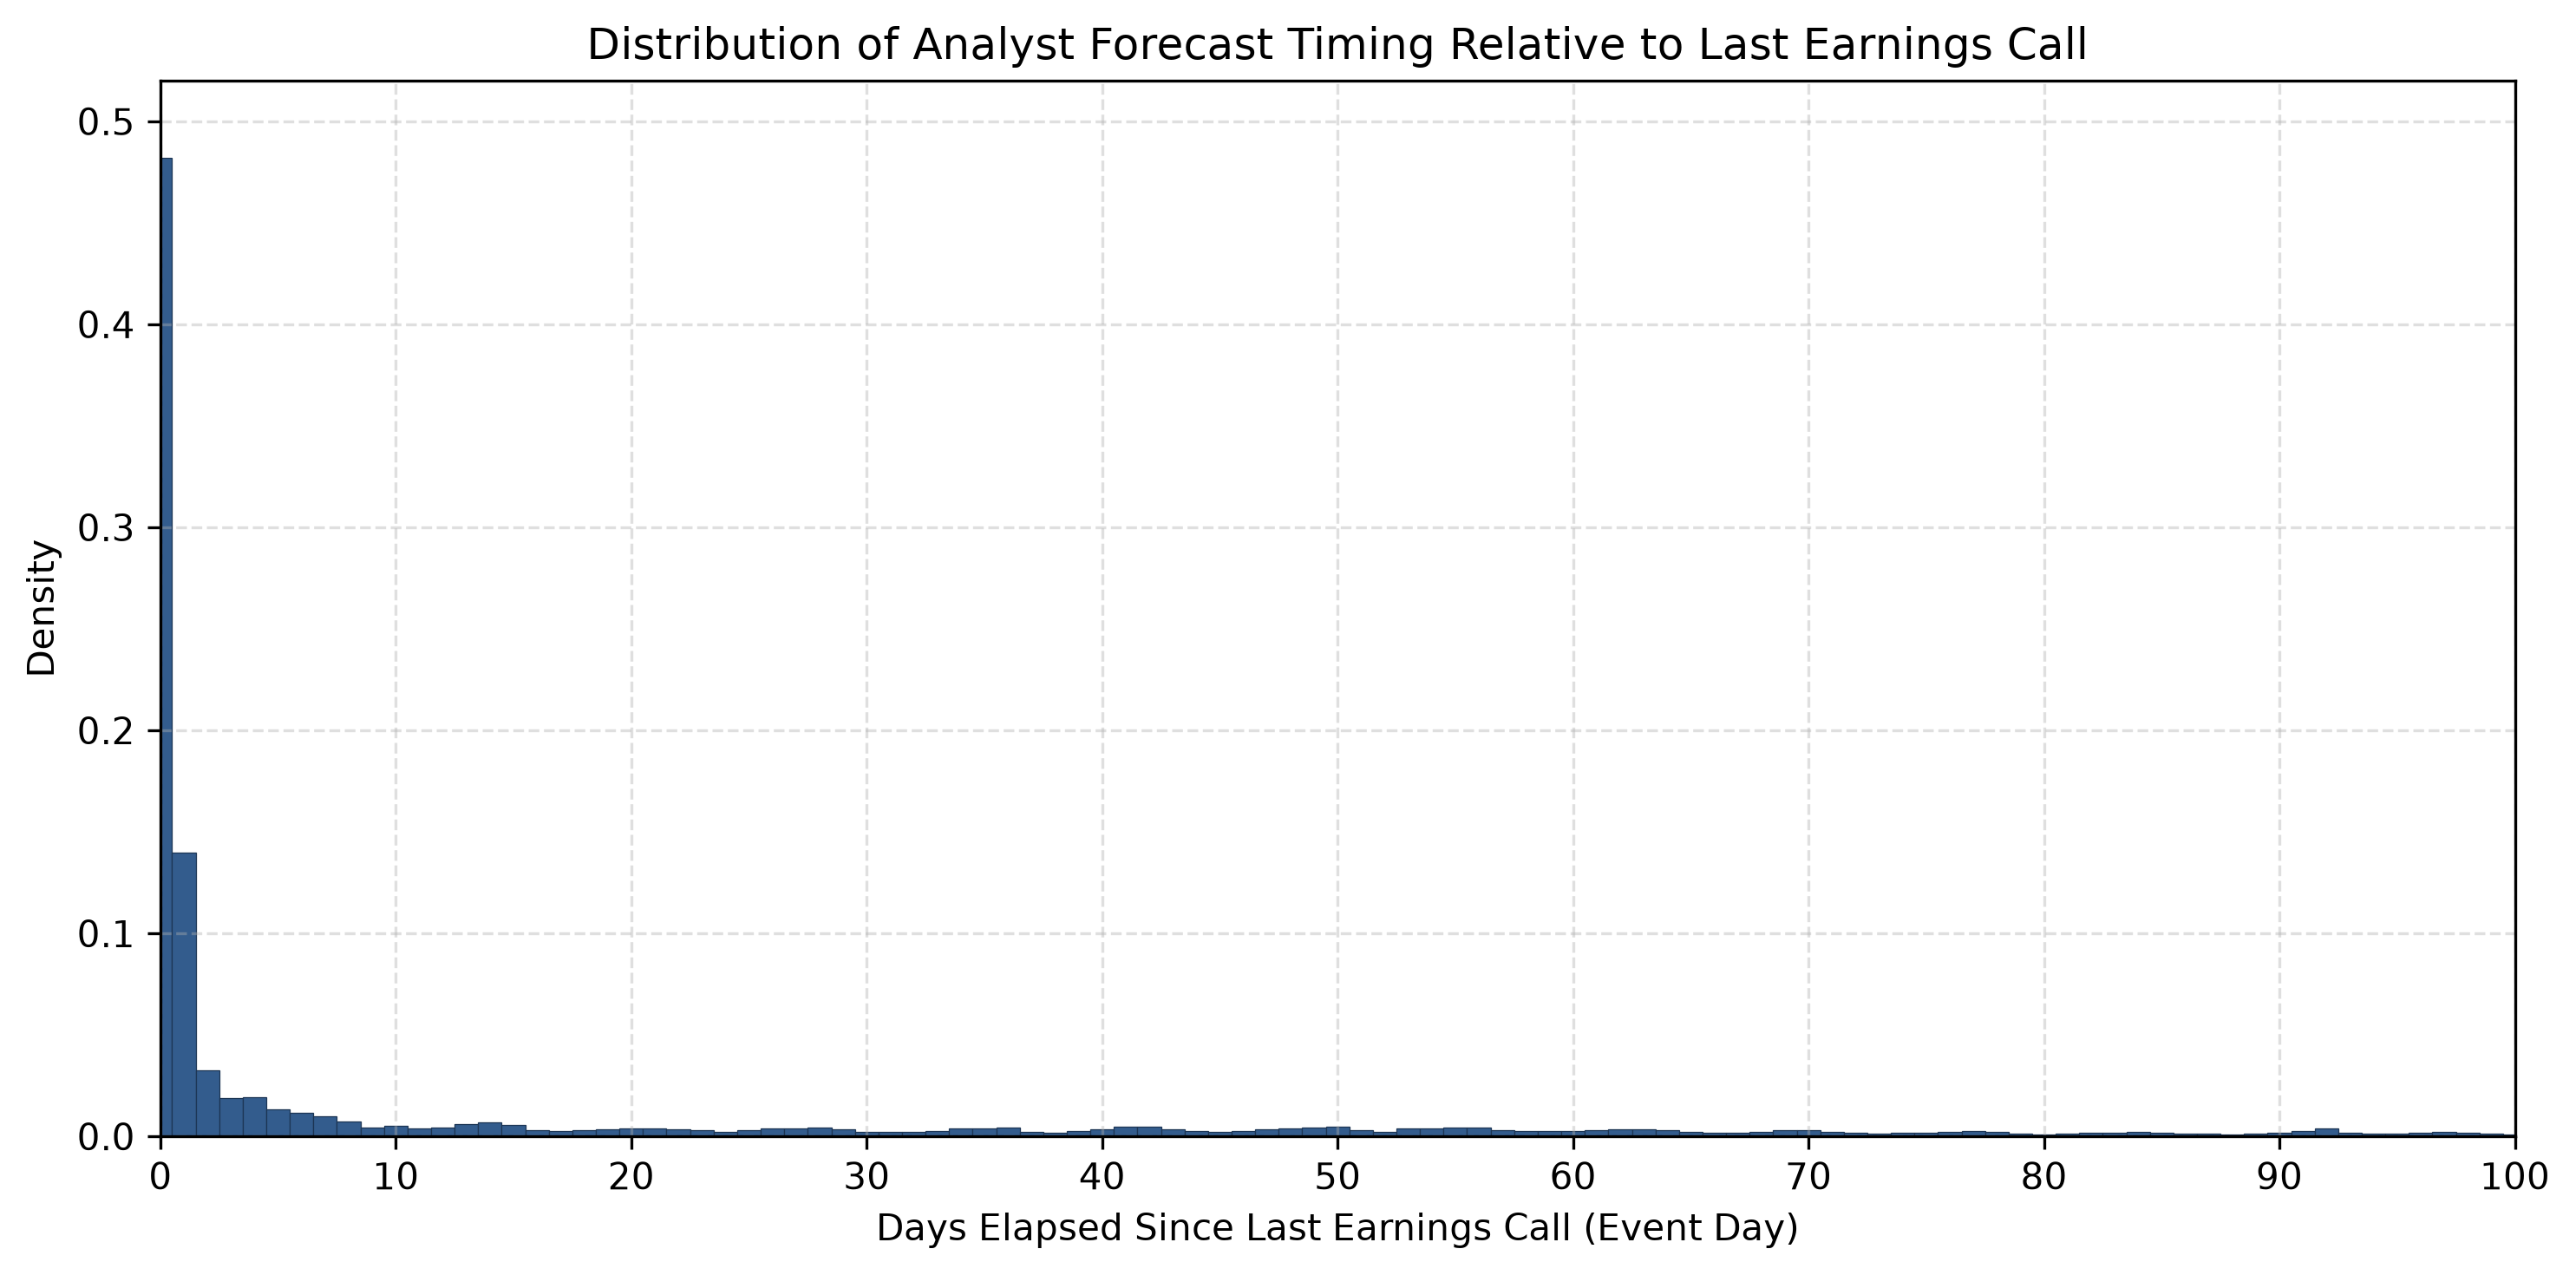
The Figure 1 caption and the §1 text say the baseline sample is "12-month I/B/E/S forecasts … published within 100 days post-earnings (746,626 forecasts), of which 272,741 … were published specifically on Day 0". That gives a Day-0 share of 272,741 / 746,626 = 36.5%. The bar at Day 0 in the figure reaches 0.48. These two numbers cannot describe the same data.
2Reverse-engineered funnel
I matched every count in the report to a saved script output or a file row count. The funnel crosses between three different datasets without saying so.
| Report step | Count | Where it actually comes from | Status |
|---|---|---|---|
| Raw one-year price targets | 1,276,627 | Row count of ibes_nptgsum.parquet, the summary / consensus file (one row per ticker-month), not analyst-level | consensus level |
| − recording errors, − unmapped CUSIPs | −1,747 / −77,568 | 1,276,627 − 1,747 − 77,568 = 1,197,312 = row count of cleaned_consensus_targets.parquet. Nothing downstream uses this file. | dead end |
| "Within the first 100 days" (analyst-level) | 746,626 | tight_window_analysis_row_level.parquet, built from ibes_nptgdet (analyst detail). Its own report says Filter window: days_since_earnings in {0, 1}. It holds 281,535 Day-0 and 465,091 Day-1 rows and nothing else. | mislabelled |
| (script 10) drop events with no 4-case match | −26,269 → 720,357 | dataset_filtering_retention_report.txt. The report skips this step. | omitted |
| Day 0 (trading-day matched) | 272,741 | Script 10: 37.86% of 720,357, or 36.5% of 746,626. Either way, this is Day 0 as a share of Days 0–1 only. | count correct |
| Firm-date median consensus | 122,958 | consensus_with_base_prices_diagnostics_sp500.txt | consistent |
| S&P 500 universe (size rank 1–500) | 31,285 | Same diagnostics file | consistent |
| ≥3 analysts on Day 0 | 28,807 → 13,817 | consensus_with_signals_diagnostics.txt. The input is 28,807, not 31,285, so it comes from a different run. | run mismatch |
3Why the figure shows 48%
The figure file in the report, analyst_days_since_earnings_distribution.png, is written by max/7_forecast_anchor_distance_histogram.py. That script has no fixed input. Its find_full_window_dataset() function:
- searches the whole repository for
*.parquetfiles and skips names containingtight,twoday,2day,filteredor0day. That rule excludes the real price-target files. - keeps any file that has an earnings-date column (
anndats_act) and a forecast-date column (anndats). The EPS detail files also have both. - picks the file with the largest size on disk:
ibes_prev_earning_date_with_day_gap.parquet(497 MB, 33.8M rows). This isibes_ndet(I/B/E/S EPS estimates,fpi1/2/6/7…, median value 0.68) with extra columns added.
selected = max(candidates, key=lambda f: f.stat().st_size) # line 43: "the raw untruncated dataset"In that file, anndats_act is the announcement date of the fiscal period being forecast, so 89.8% of the EPS estimates fall before it (negative gap). Only 40,198 of 33.8M rows land in 0–100, and 19,370 of those are on Day 0: 48.19%. Running the script's selection and binning logic reproduces the plotted 0.482 bar exactly. The hard-coded ax.set_ylim(0, 0.52) was set to fit that bar.
The script also has a guard that rejects the right data:
if pd.isna(max_day) or max_day <= 1:
    raise ValueError("... This file is still a 2-day truncated dataset ...")
The only price-target files available were the {0,1}-truncated ones. The file-name filter and this guard together pushed the script onto the one large file that passed, which was the wrong dataset. The script ran without errors and printed a path that nobody checked.
4Why the text's 36.5% is also wrong
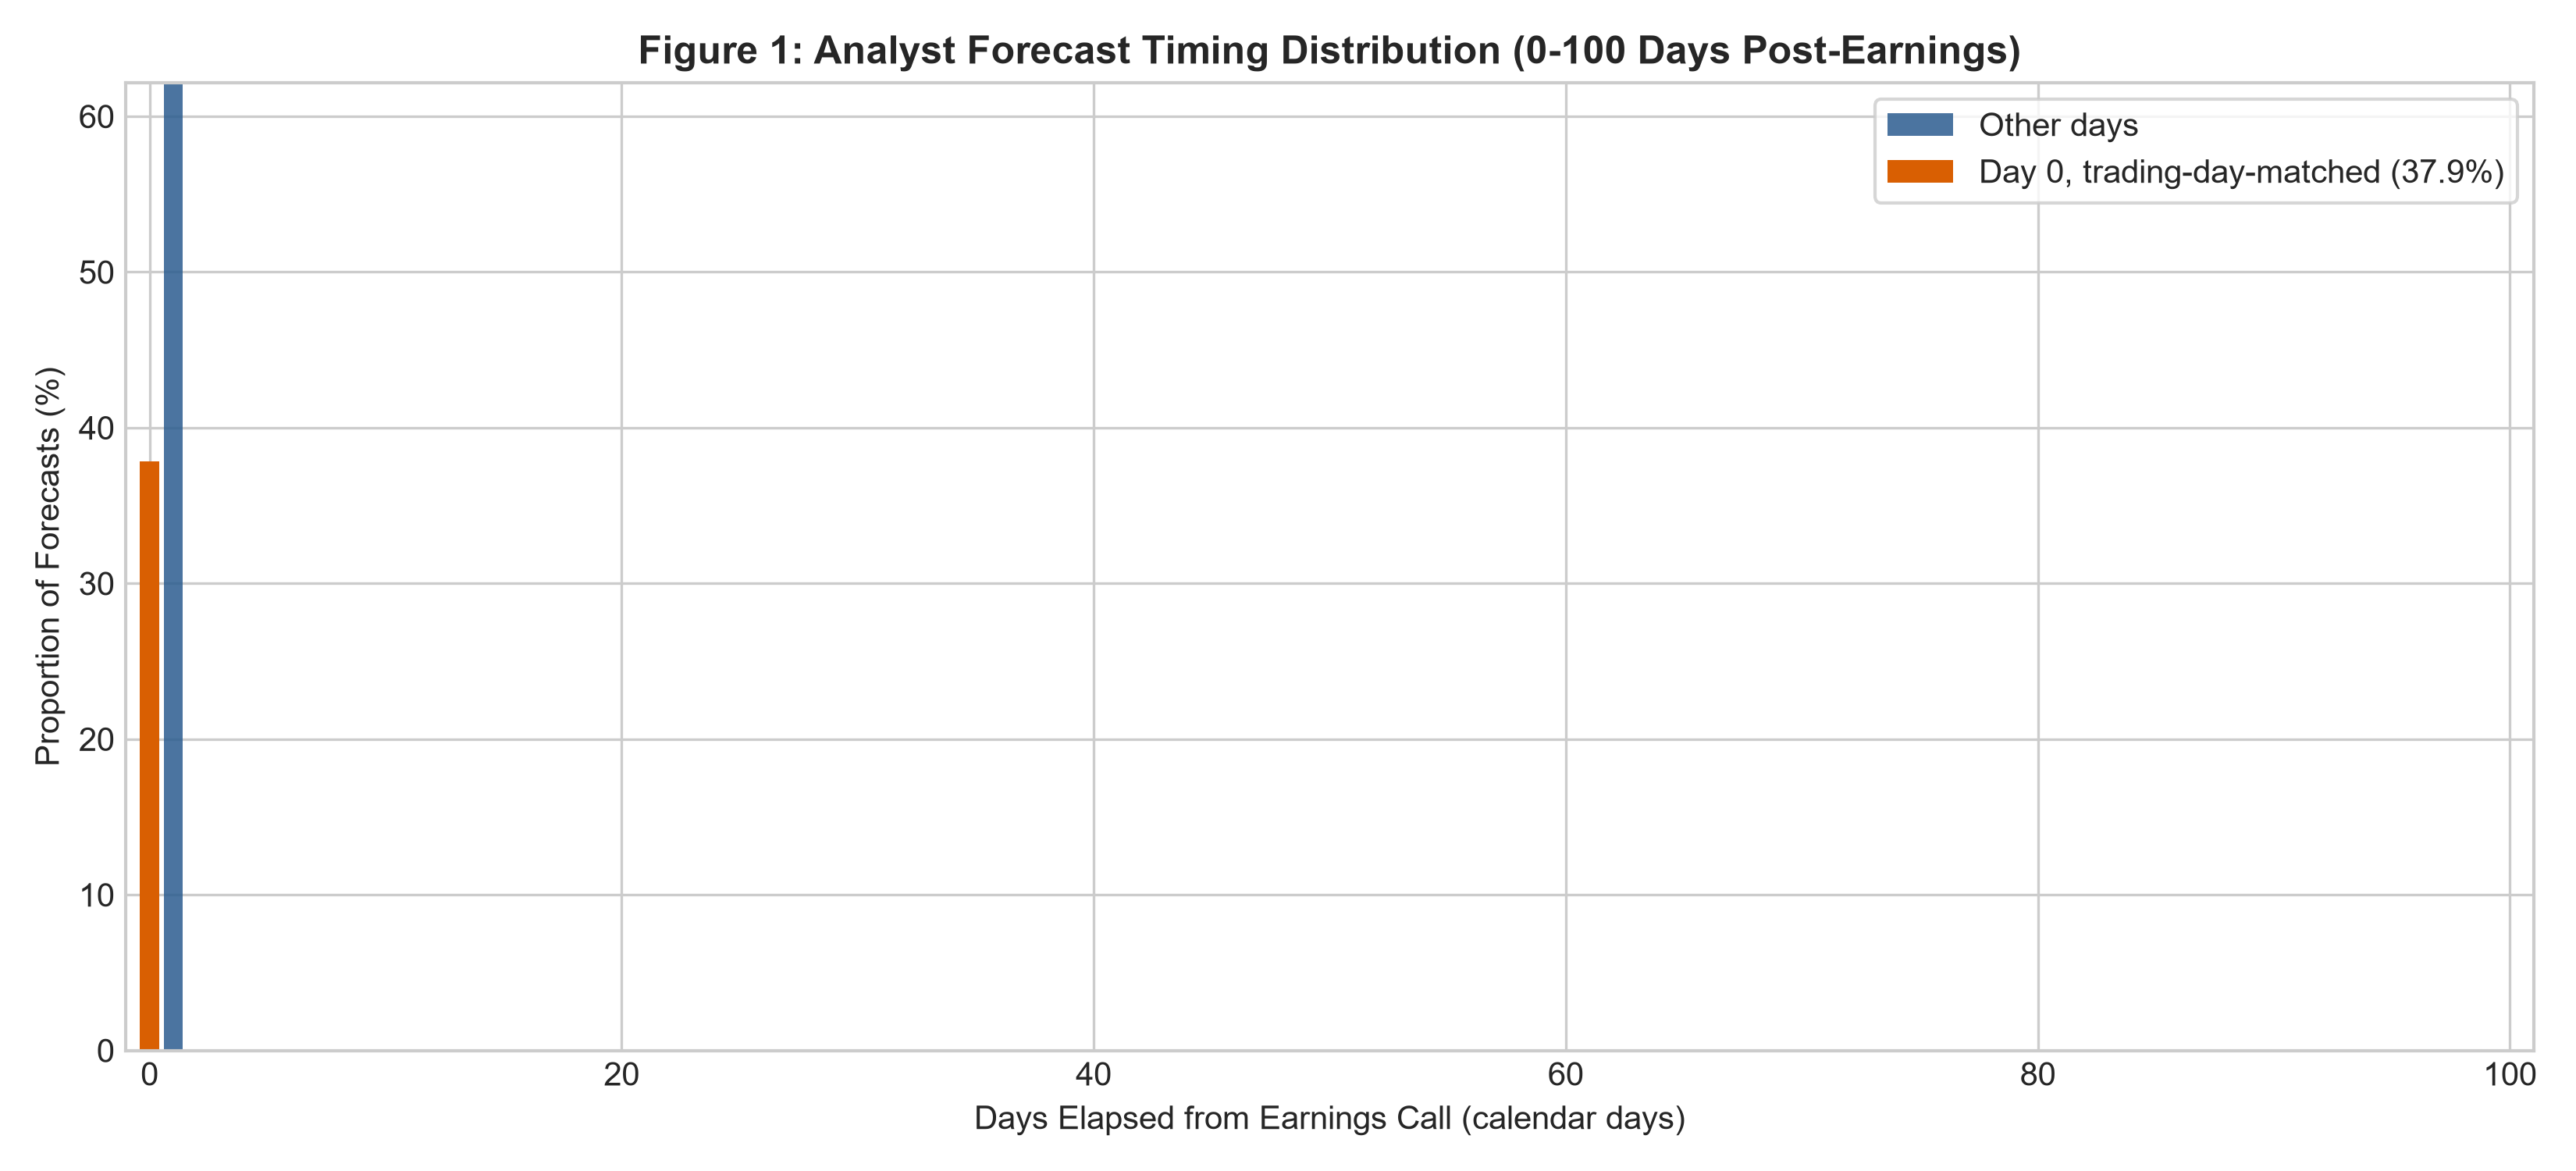
10_filter_0day_after_earnings.py honestly labels its 0–100 window, but the input it filters (tight_window_analysis_row_level.parquet) contains only Days 0 and 1. The "0–100 window" step therefore removes nothing. The 746,626 / 720,357 denominators are "Day 0 + Day 1", and 272,741 / 720,357 = 37.86% is the Day-0 share of a two-day sample. The script's own plot (§6, right) shows this: it has exactly two bars. No script in the repo creates the {0,1} file. Its builder is missing, and max/ is not under git.
5Ground truth: rebuilt 0–100 day sample
ibes_nptgdet.parquet (analyst-level price targets), kept horizon == 12 (2,232,850 rows) and mapped CUSIP→PERMNO with cusip_permno.parquet (2,161,883 rows). I attached each target to the most recent earnings announcement on or before its date for the same ticker (merge_asof, backward), using I/B/E/S actuals (ibes_nact). Then gap = forecast date − earnings date, in calendar days.Validation against the report's own file. My rebuild gives 726,995 rows at gap ∈ {0,1} (their file: 746,626) and 272,349 at Day 0 (their trading-matched count: 272,741). 97.0% of their rows appear in the rebuild with the same earnings date. Using
ibes_ndet for the earnings dates instead gives 12.85%. The result does not depend on that choice.
| Window 0–100 days after the last call | Forecasts | Share |
|---|---|---|
| Day 0 | 272,349 | 12.77% |
| Day 1 | 454,646 | 21.32% |
| Days 2–100 | 1,405,607 | 65.91% |
| Total in window | 2,132,602 | 100% |
| Outside window (>100 days, or before the first recorded call) | 29,281 |
If the rebuild is scaled up by the ~2.7% row gap to the report's file, the Day-0 share stays between 12.5% and 12.8%. The report's own downstream number, 272,741 Day-0 forecasts, is essentially right. What is wrong is the denominator: about 2.13M forecasts fall in the 0–100 window, not 746,626.
6The three distributions side by side
7Fixes
- Replace Figure 1 with a histogram of the rebuilt price-target sample. It should show a Day-0 bar of about 12.8% and a Day-1 bar of about 21.3%.
- Rewrite the §1 text: "≈2.13M analyst-level 12-month price targets were published within 100 days after an earnings call, of which 272,741 (≈12.8%) were published on Day 0."
- Script 7: remove
find_full_window_dataset()and read one explicit, named input. Add assertions that the input is price-target data (for example, aprice_target/forecast_pricecolumn is present). - Recover or rewrite the missing builder of
tight_window_analysis_row_level.parquet. Keep a 0–100 day intermediate file so the Day-0 filter runs on the real window. - Fix the funnel: the 1,276,627 → 1,197,312 steps belong to the consensus summary file. Either drop them or restate the funnel on
ibes_nptgdet(2,299,723 raw → 2,232,850 12-month → 2,161,883 mapped). Also report the 26,269-row unmatched-event drop, and rerun so 31,285 and 28,807 agree.
8Reproduce
The scripts are in /root/home/kurby/playground/max_error/repro/. Run them from forecasting-bias-ibes/ with pandas and pyarrow installed.
python repro/select_like_script7.py   # which parquet script 7 picks (EPS file)
python repro/share.py ibes_ndet.parquet max/outputs_max/price_target_pipeline/tight_window_analysis_row_level.parquet
                                     # 48.19% on the EPS file; the tight file only has days 0 and 1
python repro/rebuild.py              # ground-truth 0–100 day price-target sample: Day 0 = 12.77%